A trained neural network is, exactly, a Hamilton–Jacobi PDE, and training searches for
its initial data. A single deformation parameter ε ties together four views: network,
tropical algebra, viscous PDE, and convex optimization.
Jose Marie Antonio Miñoza1 · Erika Fille T. Legara1,2 · Christopher P. Monterola2
1Center for AI Research PH 2Asian Institute of Management
Training a neural network is identified, exactly, as a search through Hamilton–Jacobi
initial-value problems: each gradient step selects the initial data of a viscous
Hamilton–Jacobi equation whose Hopf–Cole propagator best fits the observations; at
inference, the input is the spatial point at which that solution is evaluated and the initial
condition is already encoded in the weights. The correspondence is exact for log-sum-exp layers
and structural for broader architectures: residual networks, transformers, and recurrent
architectures (RNNs, LSTMs, SSMs) each discretize the same class of Hamilton–Jacobi
equations, with architecture-dependent Hamiltonian and viscosity. A single deformation parameter
ε unifies all four perspectives (network, tropical algebra, viscous PDE, convex
optimization) in a commutative diagram closed under Lipschitz conditions. Quantitative
consequences include the minimax-optimal generalization rate
\(O(n^{-1/(d+2)})\) for fixed t, adversarial robustness
controlled by ε, backpropagation as the co-state equation of the Hamiltonian
system for residual networks, scaling exponents consistent with data intrinsic dimension via PDE
quadrature, and a closed-form O(N) influence function whose entropy landscape
undergoes fold bifurcations as ε increases.
A single ε unifies four perspectives
Neural Network
ε = softmax temperature
Tropical Algebra
ε = Maslov deformation (ε → 0: max-plus)
Viscous PDE
ε = viscosity
Convex Optimization
ε = regularization strength
Training Is a Search Through Hamilton–Jacobi Problems
Training a neural network is identified, exactly, as a search through Hamilton–Jacobi
initial-value problems: each gradient step selects the initial data of a viscous Hamilton–Jacobi
equation whose Hopf–Cole propagator best fits the observations; at inference, the input is the
spatial point at which that solution is evaluated, and the initial condition is already encoded in the
weights. Press Play and watch it happen: a small network trains live (Adam) to fit the target on the
left. With one layer the network is a single convex Hamilton–Jacobi layer —
the middle panel reads its initial data \(g(y)\) (the Legendre transform of the output) and the right
panel runs that equation forward in time. A convex layer can fit only convex shapes, so pick a
non-convex target (sine, double well) and watch it fail with no hidden blocks, then drag blocks into the
network below: composing convex layers yields a non-convex function that fits them — the paper's
multilayer construction, each block one Hamilton–Jacobi step.
targetstep 0
Build your network — drag a block in (or click to append). A Dense block applies a softplus, the ε-smoothed max that makes each layer an exact Hamilton–Jacobi step; without it, stacked linear maps would collapse to one. ResNet adds a skip; Self-Attention is a Gibbs average over the hidden units.
Dense
ResNet
Self-Attention
What the network outputs, vs the target it is learning
ε = 0.20
⎯⎯ target ▮ network output \(f_\varepsilon\) (the HJ solution at time t)
The starting data the network is choosing (the equation's initial condition \(g\))
lr = 0.050
⎯⎯ target's initial data ▮ recovered from the output (Legendre transform)
Run the learned equation forward in time \(u(x, s)\)
time s = 1.00
▮ viscous \(u_\varepsilon\); at s = t it equals the output.
At L = 1 also: ● data atoms,
⎯⎯ Hopf–Lax. At L > 1 the
deep output is run forward in time (s ≥ t).
3D: how the output bends with input x and the smoothing knob \(\varepsilon\)
Each slice along \(\varepsilon\) is the net's function at that viscosity: sharp/tropical at small
\(\varepsilon\) (front), smooth at large \(\varepsilon\) (back). Holds at any depth; updates live.
How the trained model behaves: hallucination, error, sensitivity
Where the model is prone to hallucinate (input x vs the knob \(\varepsilon\))
▮ leans on essentially one example, so it extrapolates confidently (hallucinates) ▮ blends many examples (safer); dashed = current \(\varepsilon\). (Technically: red = energy gap \(\Delta/\varepsilon \gg \log N\).)
How far the output strays from its top match, and the guaranteed limit
▮ how far the answer drifts from its single best match ⎯⎯ the proven maximum drift (never exceeded). Works at any depth. (Bound: \(\varepsilon\log(1+(N-1)e^{-\Delta/\varepsilon})\).)
How sensitive the output is to input changes, and its certified limit
▮ measured \(|f''(x)|\) (max over x), any depth
⎯⎯ certified upper bound (never violated); vertical line =
current \(\varepsilon\). At one layer this is the paper's \(\|W\|^2/\varepsilon\) theorem; deeper, it is the
exact LSE Hessian identity \(f'' = \mathbb{E}_\pi[z''] + \mathrm{Var}_\pi[z']/\varepsilon\) bounded over the features.
This is the Hamilton–Jacobi reading of training. At L = 1 the left curve is the
network output (an HJ solution at time t), the middle curve is its initial data \(g(y)\) recovered as
the Legendre transform, and the right panel runs that equation forward in time. Their agreement is the
claim: gradient descent is a search over Hamilton–Jacobi initial-value problems. At
L > 1 the network is a composition of L such layers, so the single-equation reading
(middle and right panels) no longer applies as one equation; the fit panel shows depth doing what a
single convex layer cannot.
In plain terms: one layer can only bend one way (convex), so
it cannot trace a wave. Stack layers and the bends compose into any shape, while each layer stays one
Hamilton–Jacobi step.
The Central Idea
Conventionally the question runs one way: given a PDE, design a network to approximate its
solution. Here a trained network already is a Hamilton–Jacobi equation, and the
question is which one.
The key is a single deformation parameter ε and ultradiscretization,
the exact passage ε → 0 between two algebraic worlds. At
ε = 0, addition is max and multiplication is + (the tropical semiring); at
ε > 0, ordinary arithmetic is restored and the same objects reappear as the
solution operator of a viscous PDE. This passage is not an approximation but an exact
semiring homomorphism, the Maslov dequantization.
The object realizing this is a log-sum-exp layer:
\[ f_\varepsilon(x) \;=\; \varepsilon \log \sum_{j=1}^{N} \exp\!\Big( (W_j \cdot x + b_j)/\varepsilon \Big). \]
The Hopf–Cole linearization identifies it exactly as the heat-equation propagator of a
viscous Hamilton–Jacobi equation: the weights encode the initial data, the architecture
encodes the Hamiltonian, and a forward pass evaluates that PDE solution at the query point.
The correspondence assembles into a commutative diagram
Moving right is ultradiscretization (Maslov dequantization): the smooth
ε > 0 object hardens into its tropical / Hopf–Lax limit as
ε → 0. Moving down is the exact identification of the network
layer with the PDE solution. The square commutes: the two limits
(ε → 0 and width N → ∞) can be taken in either order and
give the same answer.
The Feynman–Kac formula is the unifying object: each neuron is a discrete path weighted by
a Boltzmann factor, and the forward pass computes the log-partition function of the ensemble.
In Plain Terms
A trained network is a physics equation in disguise. Normally you pick an equation
and build a network to approximate its solution. This work reverses that: once a network is trained,
it already is the exact solution of a specific Hamilton–Jacobi equation, the kind that
describes how a wavefront spreads or how a particle finds its least-effort path. Training searches
for which equation (its starting shape) fits the data, and a forward pass reads off that solution at
your input.
One knob, ε, controls everything. Turn it down and the network
becomes sharp and decisive, picking the single best match. Turn it up and it blends many options
smoothly, the way heat diffuses and blurs detail. The same number plays three roles at once: the
softmax temperature, the equation's viscosity, and the strength of the regularization.
The same limit links quantum to classical physics. Sharpening the knob fully
(ε → 0) turns a soft, probabilistic computation into a hard, deterministic one,
the same move that takes quantum mechanics to classical mechanics as Planck's constant vanishes. A
forward pass is then a sum over paths, as in Feynman's path integrals, but with positive weights,
which is what keeps it computable on an ordinary computer.
Interactive: The Deformation Parameter ε
The log-sum-exp layer is a smooth deformation of the tropical max. Drag ε to see
LSEε(a, 0) relax toward max(a, 0)
(left) and its gradient become the Gibbs / softmax weight
σ(a/ε) (right). As ε → 0 the smooth layer
hardens into the Hopf–Lax lookup; as ε grows it becomes the viscous heat
propagator.
Layer output: \(\mathrm{LSE}_\varepsilon(a,0)\) vs \(\max(a,0)\)
The gradient is exactly the softmax (Boltzmann–Gibbs) weight, a probability for all ε > 0.
Here ε is at once the softmax temperature, the PDE viscosity, and the
convex-regularization strength; these are the same parameter, not separate analogies.
In plain terms: small ε gives a sharp,
confident decision; large ε gives a soft, blurred average. The dashed red limit
(ε → 0) is the Hopf–Lax rule: take the single
best-scoring option, with no blending. More generally, Hopf–Lax gives the answer as the best
trade-off of starting value plus travel cost over all starting points, the cheapest-path
principle. The curve on the right shows how much credit each option gets.
Interactive: Particle ↔ Wave Phase Transition
The attribution weights \(\pi_j(x;\varepsilon) \propto \exp\!\big((W_j \cdot x + b_j)/\varepsilon\big)\)
form a closed-form influence function. These weights are a Gibbs measure: a
probability distribution that gives each neuron a share proportional to exp(score / ε),
so higher-scoring neurons get exponentially more weight and ε sets how peaked the split
is. This is exactly the softmax, the same rule statistical physics uses to weight states by energy.
As ε sweeps, this measure transitions from a concentrated particle
regime (Hopf–Lax, ε → 0) to a spread-out wave regime (heat
equation, ε → ∞). Drag ε and watch the weights and their
entropy H(π) change. The critical scale is \(\varepsilon^* = N^{-1/d}\).
Attribution weights \(\pi_j\) over neurons
ε = 0.50
Low ε → one neuron dominates (particle). High ε → uniform spread (wave).
Attribution entropy \(H(\pi)\) vs \(\varepsilon\)
marker tracks slider
Entropy rises monotonically with ε; fold bifurcations merge attribution basins along the way.
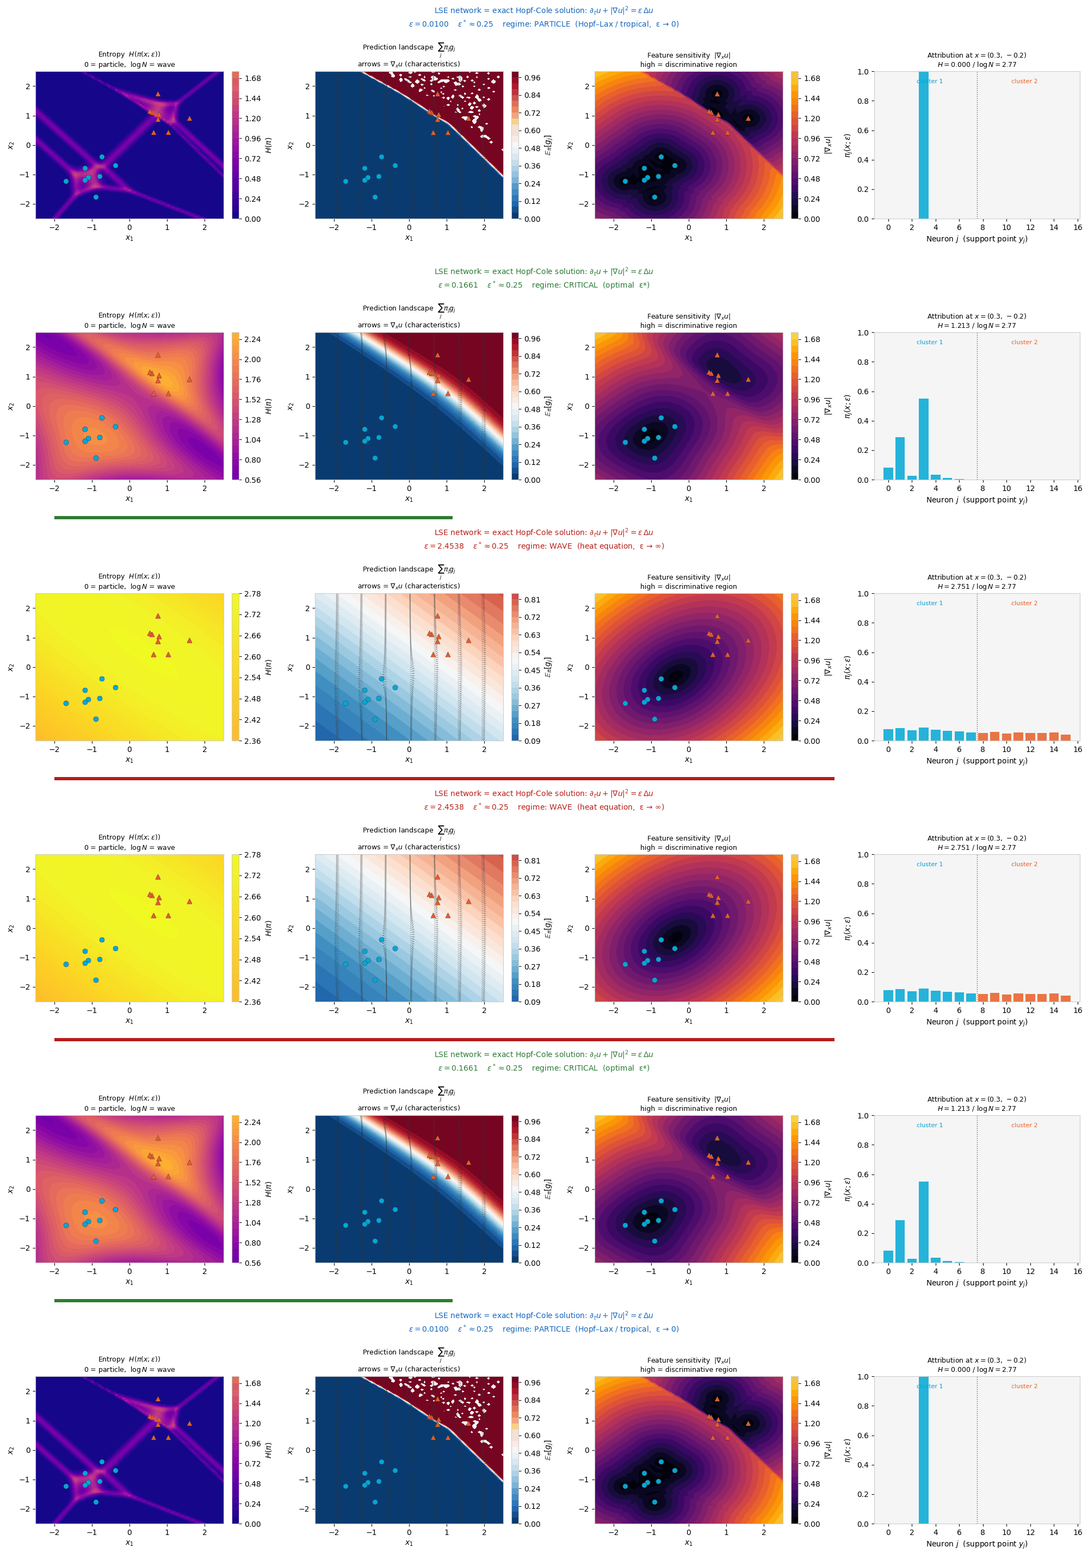
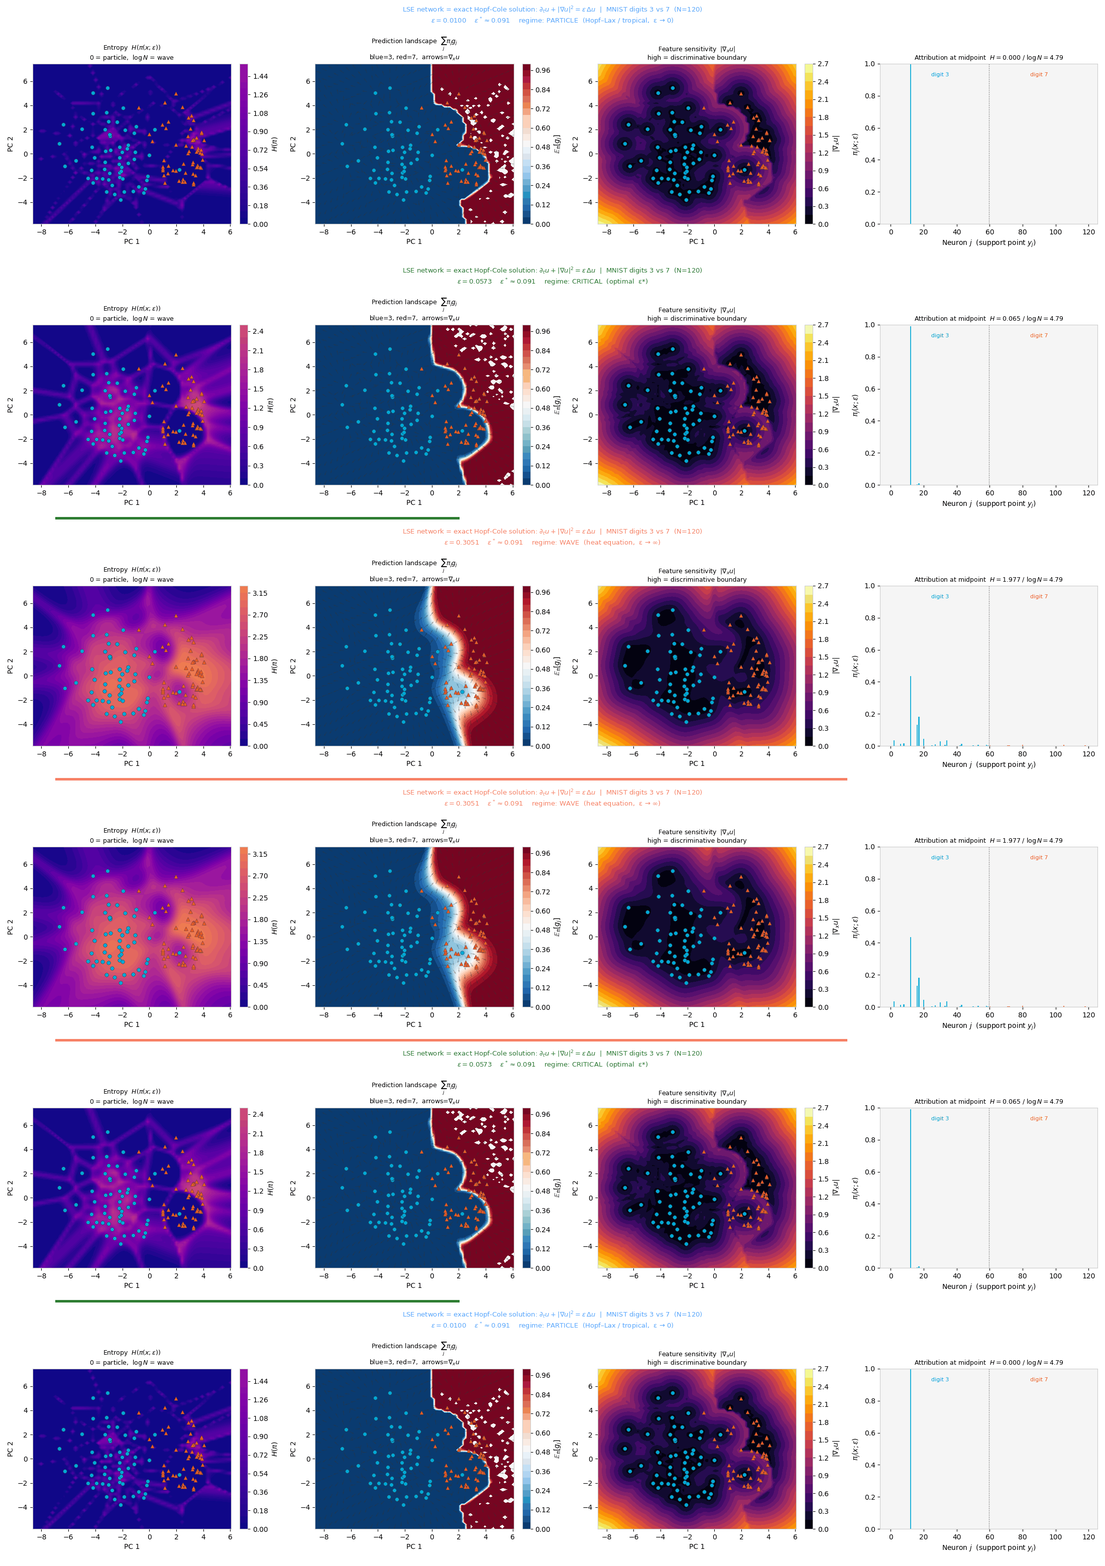
The same particle-to-wave transition appears below on synthetic and MNIST data: the entropy landscape
H(π) reorganizes through fold bifurcations as the viscosity ε increases.
In plain terms: at low ε a prediction is
explained by essentially one training example (a particle); at high ε it is a smeared
average over many (a wave). The switch happens at a predictable scale.
The same axis in a real pretrained transformer (distilgpt2)
Each attention row is a Gibbs measure \(\pi\) over keys (effective temperature
\(\varepsilon=\sqrt{d_{\mathrm{head}}}=8\) for distilgpt2). The normalized entropy
\(H(\pi)/\log k\) of a head separates particle heads (focused, retrieval-like,
low entropy) from wave heads (diffuse, mixing, high entropy). These are real
attention tensors, precomputed and loaded as data. Click any head to see its actual attention matrix.
How the dynamics change with depth: per-head entropy \(H(\pi)/\log k\) vs layer (depth = HJ time)
● individual heads
● layer mean
░ min–max band
● selected head
Depth plays the role of time, so reading the entropies layer by layer shows how the attention
measure evolves: it drifts from diffuse (wave) early toward focused (particle) by the middle layers,
with a mild rebound at the end. Driven by the same sentence selector and head click above.
What wave vs particle means in practice
Particle head
Low \(H\): focused on one or a few tokens. Does precise routing such as
retrieval, copying, and induction. The \(\varepsilon \to 0\) Hopf–Lax / nearest-neighbour
limit: sharp and discriminative, but high-curvature, so more brittle and more hallucination-prone.
Wave head
High \(H\): spread over many tokens. Does aggregation such as context
mixing, smoothing, and pooling. The \(\varepsilon \to \infty\) heat-diffusion limit: robust and
stable, but low-resolution and less discriminative.
You want the spectrum
Not all-particle (brittle, fragile to pruning) nor all-wave (blurry, cannot copy
or route). Healthy models span both, and the pattern is visible here: early layers lean
wave (gather context), later layers lean particle (decide and retrieve).
The aim is not more waves or more particles, but the right mix. A head's regime is
not set directly; it emerges from learned \(QK\) weights at a fixed base temperature
\(\varepsilon = \sqrt{d_{\mathrm{head}}}\). Several choices shift the distribution: a larger
\(d_{\mathrm{head}}\) raises the base temperature (more wave-leaning); more heads and more depth give
room to specialize; an attention-entropy penalty can push heads toward particle or wave on purpose.
The middle ground is the attention analog of the optimal viscosity \(\varepsilon^*\): sharp enough to
route, smooth enough to stay robust, the same approximation-versus-robustness trade-off found elsewhere
in the framework. In this model the heads already span the full range, from \(H/\log k \approx 0.02\)
to \(\approx 0.88\).
Rule of thumb (interpretive): diversity beats extremes.
Heads pinned near maximum entropy may be doing little useful work (pruning candidates); heads near
zero entropy are load-bearing routers, so do not prune them, but watch for brittleness.
Dynamic Results: The Phase Transition in Action
Animations of the LSE network as a Hopf–Cole solution as the viscosity ε
sweeps across the critical scale ε* = N−1/d.
Synthetic (two-cluster). Attribution basins sharpen in the particle regime and flatten to uniform entropy in the wave regime.
MNIST (3 vs. 7). The decision boundary follows inter-cluster geometry in PCA space; ε* ≈ 0.091.
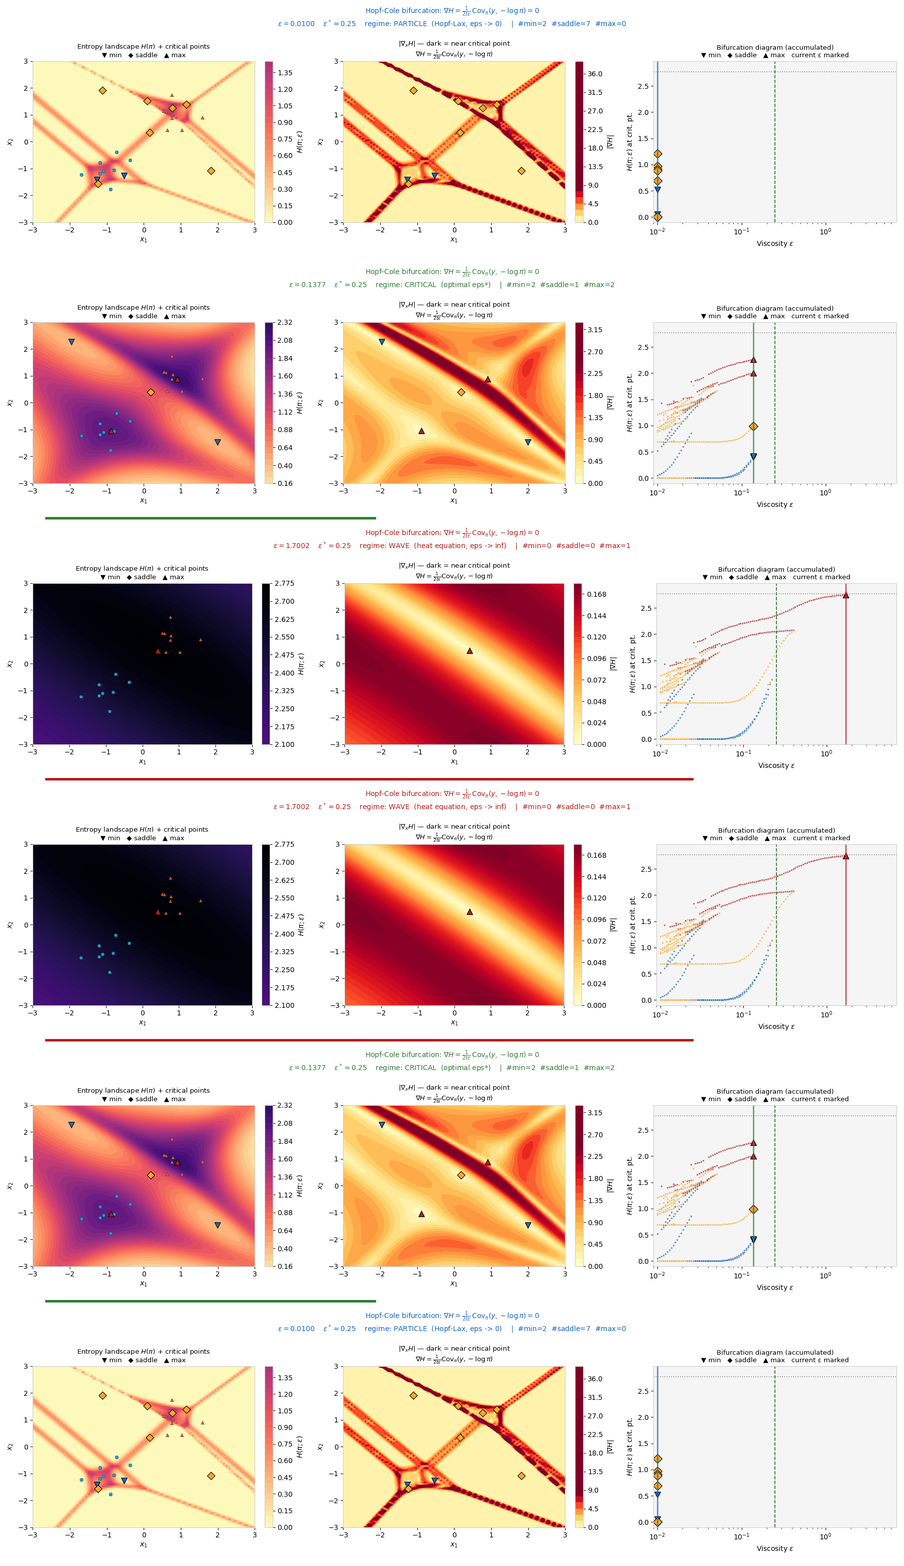
Bifurcation cascade. Critical points of the entropy landscape H(π) annihilate in fold bifurcations as ε increases. Explore this live in the interactive below.
Interactive: Fold Bifurcations of the Attribution Landscape
Along a 1-D slice through the data, the attribution entropy H(π(x;ε)) has a basin
(local minimum) near each support point and a ridge (local maximum) between neighbours. As the viscosity
ε increases, neighbouring basins merge: a minimum and an adjacent maximum collide and
annihilate in a fold (saddle-node) bifurcation. Drag ε to watch critical
points disappear; the right panel traces each critical point's entropy value across ε.
▽ minima (attribution basins)
△ maxima (attribution ridges)
Bifurcation diagram: critical \(H\)-value vs \(\varepsilon\)
vertical line tracks ε
Each branch annihilation is a fold bifurcation, merging one attribution basin.
This is the interactive counterpart of the cascade animated above: as ε grows the
entropy landscape simplifies, each fold event collapsing a minimum–maximum pair into a single
smoother region.
In plain terms: picture a landscape of valleys and ridges.
As you blur it, neighbouring valleys merge into one not gradually but in a sharp jump. Each jump is the
model treating two groups of examples as one.
Interactive: Implications (Hallucination and Double Descent)
The same correspondence pins two well-known failure modes down as exact geometric statements.
Hallucination is deterministic out-of-distribution extrapolation: outside the
diffusion radius \(\sqrt{2\varepsilon t}\) of every training point, the output collapses to the
dominant neuron's linear continuation, ungoverned by the data. Double descent is
the curvature \(\|\nabla^2_x f\| = \mathrm{Var}_\pi[W]/\varepsilon\) peaking at the Voronoi
boundaries between neurons (near-shocks where \(\pi=\tfrac12\)); at the interpolation threshold
these shocks become dense.
Hallucination: output \(f_\varepsilon(x)\) vs the dominant-neuron line
Each spike is a near-shock at a neuron boundary; they sharpen as \(\varepsilon \to 0\).
Both follow from the geometry. Hallucination is governed by the viscosity \(\varepsilon\) and by data
coverage (widening the support shrinks the red zones), while the curvature spikes explain why error can
rise again at the interpolation threshold.
Same geometry as the bifurcation explorer above: the teal
entropy curve \(H(\pi)\) is low inside the hallucination basins (the minima the bifurcation
tracks, where one neuron dominates and \(\Delta/\varepsilon \gg \log N\)) and spikes at the
neuron boundaries (the saddles and maxima), which is exactly where the curvature peaks on the right.
Hallucination, double descent, and the bifurcation cascade come from one attribution landscape.In plain terms: ask the model about something far from
its training data and it answers with a confident straight-line guess (hallucination); the
sharpest, most fragile parts of the model sit exactly on the borders between training examples.
Quantitative Consequences
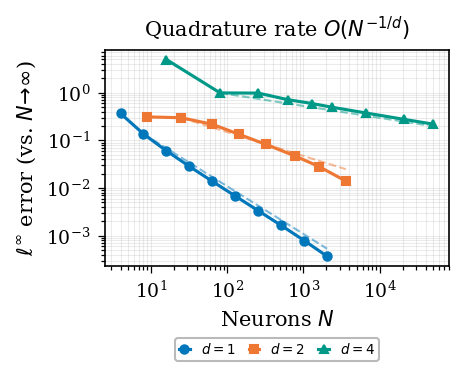
Generalization rate. ℓ∞ error vs. width N for
Lipschitz initial data across \(d \in \{1,2,4\}\); dashed \(O(N^{-1/d})\) slopes confirm the minimax
approximation rate in width (with \(N^\ast \asymp (n/M^2)^{d/(d+2)}\) this gives the
statistical rate \(O(n^{-1/(d+2)})\)).
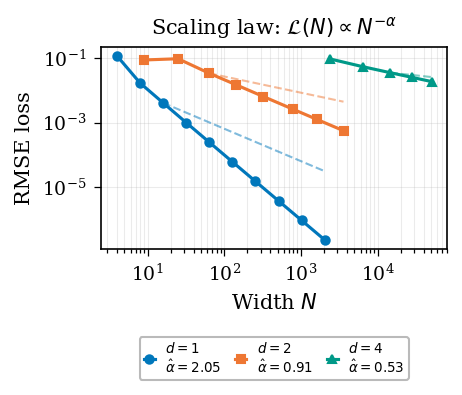
Scaling law. Test RMSE vs. width for Adam-trained LSE networks; the empirical
exponent recovers the data intrinsic dimension via PDE quadrature.
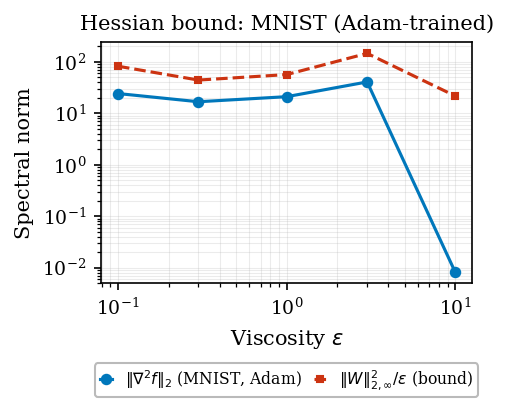
Certified robustness (MNIST). Measured spectral norm
\(\|\nabla^2_x f\|_2\) vs. the theoretical bound
\(\|W\|_{2,\infty}^2/\varepsilon\); the bound is never violated.
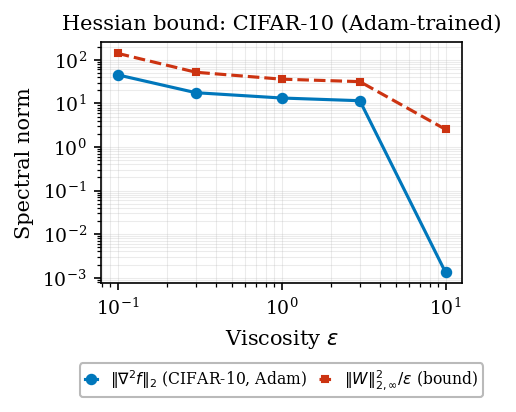
Certified robustness (CIFAR-10). Same bound across
\(\varepsilon \in \{0.1, 0.3, 1.0, 3.0, 10.0\}\); raising \(\varepsilon\) monotonically reduces
input sensitivity.
The Correspondence Is Exact
The layer–PDE identity \(f_\varepsilon + u_\varepsilon = |x|^2/(4t)\)
and the transformer attention = Gibbs-measure identity are exact algebraic statements,
not approximations: they hold to floating-point roundoff across all ε, d, and
random trials tested. The useful question is then which architectures and activations
admit such an exact Hamilton–Jacobi identity, and which do not.
HJ correspondence status for common activations
Activation
Tropical limit (ε→0)
Finite-ε structure
Exact HJ identity
LSE
\(\max_j(W_j \cdot x + b_j)\)
Hopf–Cole solution
Yes (solution-class)
ReLU
\(\max(x,0)\)
2-neuron LSE special case
Yes (special case)
Softplus
\(\max(x,0)\)
\(\log(1+e^x) = \mathrm{LSE}_1(x,0)\)
Yes (N=1 case)
Sigmoid
Heaviside
\(\nabla_x \mathrm{LSE}_1(x,0)\)
Yes (\(\nabla\)-class)
tanh
\(\mathrm{sign}(x)\)
\(\pi_+ - \pi_-\) (signed Gibbs weight)
Yes (\(\nabla\)-class)
SiLU
ReLU
\(x \cdot \nabla_x \mathrm{LSE}_1(x,0)\)
Open (one derivative off)
GELU
ReLU
\(x \cdot\) (heat kernel integral)
Open (product form)
Citation
@article{minoza2026hjdl,
  title         = {The Hamilton--Jacobi Theory of Deep Learning},
  author        = {Mi{\~n}oza, Jose Marie Antonio and Legara, Erika Fille T. and Monterola, Christopher P.},
  journal       = {arXiv preprint arXiv:2605.28983},
  year          = {2026},
  eprint        = {2605.28983},
  archivePrefix = {arXiv},
}